
What Exactly is a Moving Average?
What Exactly is a Moving Average?
A moving average is nothing more than the average of a stock’s closing price over a specified amount of time. The most commonly used moving averages calculate price over periods of 50, 100, and 200 days. They are plotted on charts as lines that follow the price action.
The most common time frames that are used when creating moving averages are the 200-day, 100-day, 50-day, 20-day and 10-day. The 200-day average is thought to be a good measure of a trading year, a 100-day average of a half a year, a 50-day average of a quarter of a year, a 20-day average of a month and 10-day average of two weeks.
The mathematics behind the moving average helps investors determine the trend of a stock
Determining the Trend
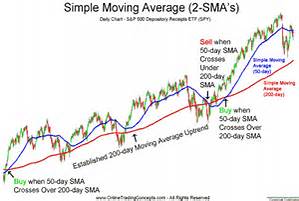
Think for a second about what a moving average is telling you. Let’s use a 50-day moving average as an example. If the stock price is above the 50-day moving average than the current price is higher than the level where the stock has been trading on average for the last 50 days. If a stock is trading higher than it has been in the past, then it must be trending higher currently. Should the stock continue to trend higher, it will stay above the average of the last 50 days.
When you experience a crossover, one period moving above another or below another is a sign that the price movement is favorable (crossing above) or negatively if the crossover is moving downward.
So the easiest way to determine what the trend is on a specific stock is to compare it to a moving average. Stock prices above the average are in an uptrend, while stock prices below are in a downtrend. It may sound like an oversimplification, but you are completely removing emotion from the equation and giving yourself a totally unbiased view of the situation.
Daniel Iuculano, AAMS CMFC
Accredited Asset Management Specialist
Chartered Mutual Fund Counselor